Some of you will have seen our distant-reading showcase poster, this one (hi-res version on figshare):
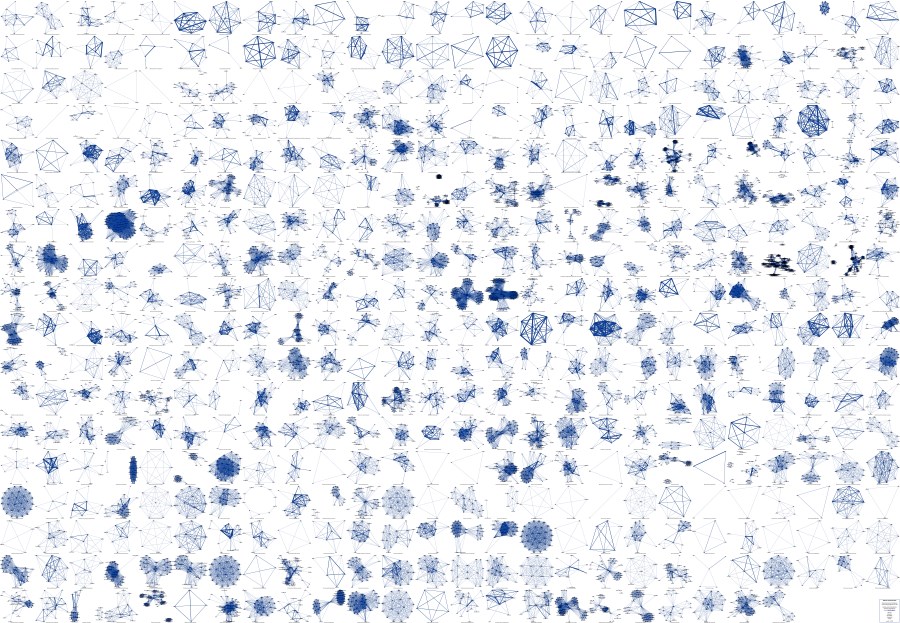
These are the character networks of 465 German-language dramas from 1731 (left upper corner) to 1929 (bottom right) at one glance. You can see how networks are changing over time, the first network explosions occurring with Klopstock’s “Hermanns Schlacht” (1769) and Goethe’s “Götz von Berlichingen” (1773): second row, fifth and second from the right.
The network of Klopstock’s piece can be studied in detail here, the Goethe one here. All 465 network graphs can be accessed in a folder on GitHub.
Character-Centric Data
Visualisations are nice, especially when they set you up with the ability to kind of read a large number of literary texts from a distant. But there are two other things we did with our data. We used network values like size, min/avg/max degree, density and avg path length to make assumptions about literary evolution over time, as described in our last posting (“Comedy vs. Tragedy: Network Values by Genre”).
But we also calculated character-centric data, play by play, to make assumptions about single characters and their position in a network. We haven’t written anything about the character-centric data yet, but the data is all there (and will probably overwhelm you at first sight), in a single HTML document.
For each character of a play, you will find the following values in the tables: degree, betweenness centrality, average distance, closeness centrality. Let me give you a small example on how to bring all this data to talk. In the second pamphlet of the Stanford Literary Lab series, Franco Moretti takes a look at the average of the distance of a character to each of the other characters, suggesting that the one with the lowest score would be the protagonist of a play (cf. “Network Theory, Plot Analysis”).
Another promising way to find the most important/most central person in a network of people is the betweenness-centrality score. To quote Wikipedia: “A node with high betweenness centrality has a large influence on the transfer of items through the network, under the assumption that item transfer follows the shortest paths.” We still have to discuss in what way this could apply to character networks of dramatic texts (“items”, in this case, could be information passed on from character to character), but let’s assume for a minute that the betweenness centrality score does correlate to the importance of a character. Then the numbers would tell us in an instant that, e.g., Emilia Galotti is not the most central character in Lessing’s play that bears her name. We knew this already, of course, but with this method we can easily generate a long list of plays whose title characters are not the most central ones, without having to actually read or reread any of the plays of our corpus. “Just think of this,” says Moretti, “I am discussing Hamlet, and saying nothing about Shakespeare’s words.” In fact, there will be some surprises if you look at our numbers. Such as this one: Lessing’s eponymous Nathan the Wise only ranks second after the sultan, Saladin.
Certainly, these are only very simple examples on how to leverage all the data we calculated. Working on such kind of models rather than on the actual text can bring a whole set of new results, it can draw our attention to aspect that went unnoticed so far. Just look at the centrality scores of Schiller’s first play “Die Räuber” which are in sharp disaccord with traditional research and our own intuition when reading the play. No doubt about it, there will have to be a lot of further research on these things.
How dramavis Works
But now onto the main thing, the foremost reason for this post is to introduce you to the tool we developed for the purposes described. It is a Python script called dramavis and was written by Christopher Kittel and me. You can find it on my GitHub account (https://github.com/lehkost/dramavis). Feel free to use it for your own purposes. To facilitate that a little, here is how “dramavis.py” works:
- The script reads character networks of dramatic pieces from CSV files,
- plots these networks into PNG graphs (using the igraph library and Fruchterman–Reingold as layout, things you can change in the code, of course),
- writes drama network values to a CSV file,
- writes drama character values to an HTML file (using the Django template language).
There are input/output directories on GitHub, so if you clone the whole shebang to your harddrive and have all the necessary libraries installed it should work out of the box and you can start adapting it to work with your own data.
As for a little history, the first version of the script was written in August, 2014, during the DARIAH International Digital Humanities Summer School in Göttingen. We were bascially toying around with the networkx and igraph libraries and fed them with some literary network data. We showed some first results at workshops in Würzburg and Munich and at DH conferences in Graz and Sydney where some people were asking for the code. We didn’t wanna put it on GitHub until we revised the somewhat chaotic script (ha!), and that’s what we did at a spontaneous 2-day hackathon at the Göttingen Centre for Digital Humanities, at Heyne-Haus, in June, 2015.
Depending on your machine, it can take up to five minutes or so to process the 465 standard input files and generate all the different outputs, so in order to know that the script is still running, we included a simple progress bar and want to include other things in the future (input formats other than CSV would be nice, for example), so if you have any suggestions, please bring them forward.
Other Approaches to Visualise Literary Network Data
This Python-based approach runs parallel to another approach based on D3.js leveraging our intermediary XML format to generate different kinds of outputs (as demonstrated on this slide from our talk at the DH2015 in Sydney). You can have a look at all the data generated via this approach at dlina.github.io/linas. There are still some bugs we have to fix, but feel free to toy around a bit. This small collection of dynamic visualisations already has traits of a toolbox for the structural analysis of dramatic texts. Either way, that’s where we’re headed.
Nothing more to say today. Happy distant reading!

/1769-Klopstock_Friedrich_Gottlieb-Hermanns_Schlacht-speakers.png)
/1773-Goethe_Johann_Wolfgang_von-Götz_von_Berlichingen_mit_der_eisernen_Hand-speakers.png)