Three weeks ago, we attended the annual Digital Humanities conference of the German-speaking countries (DHd2016), this time taking place at the University of Leipzig. We delivered two papers (more on them later) and a poster. And were really excited to be awarded the price for the best poster out of 78 poster submissions (listed in this PDF).
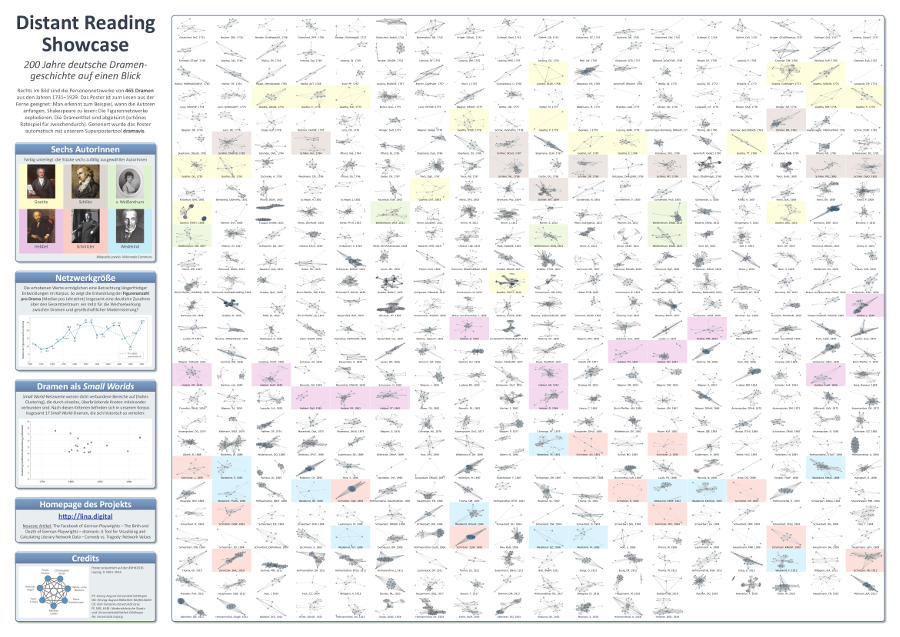
I will try to quickly explain what we tried to do when creating our poster. But first and foremost, this is the poster we’re talking about, its full title goes as follows: “Distant-Reading Showcase: 200 Years of German Drama History at a Glance”.
A full-res version can be downloaded from Figshare (PDF; 28.88 MB).
What we set out to do with this poster was to produce a data-driven showcase for what they™ call distant reading. We have a working definition of ‘distant reading’ that differs from the one that underlies Franco Moretti’s articles on the matter since he first coined the term in 2000. Just recently, Peer and I gave a talk on the matter, last November in Vienna, at a workshop dedicated to “Distant Reading and Discourse Analysis”. (The corresponding article will appear shortly, we just finished the final editing.) Let’s just point you to two aspects: Moretti never talks about programming or code and neither describes nor provides his working corpus so that anybody could reproduce his findings, two things we consider essential and tried to address throughout the course of the DLINA project (see our older postings). ‘Data-driven’ means that we wanted the computer to generate the better part of the poster, a job done by our tool dramavis which was revamped and completely rewritten from scratch just weeks before the conference (current version is v0.2).
In order to be a convincing Distant-Reading Showcase our poster should really show visualised data that could actually be read by viewers. The 465 character networks showing German-language dramas written/published between 1730 and 1930 are sorted chronologically, and one thing people should be able to spot is the decisive decade in which German authors started to binge-read and adapt Shakespeare. All of a sudden in the 1770s, they start to build character networks far bigger than the ones before: Goethe’s play “Götz von Berlichingen” is one of the first that, instead of only 8 or 12 or 16 characters, started to let more than 70 characters appear on stage. You can witness this ‘explosion’ in the 3rd row from above, 3rd column from the right. There are other things you can actually recognise in the poster, just take the network built from Schnitzler’s “Der Reigen” (“La Ronde”), which describes a circle in correspondence with the symptomatic course of the play (6th line from below, 7th column from the right; see also Gerrit Imsieke’s tweet on the matter).
At some point (when pottering about with Illustrator trying to open and convert a 20+ MB SVG) we had the notion that next time we should aim at generating the entire poster directly as script-driven SVG. But okay, this time we still managed to undertake the finishing steps on an old 2×2.8 GHz Quad-Core Intel Xeon Mac Pro with just about 6 GB of RAM using InDesign to properly fill the rest of the poster with descriptive info and some additional stuff: The two diagrams in the lower left of the sidebar already show further parts of our research, one of them the number of dramas with ‘small world’ characteristics, something we will also talk about at the DH2016 in Krakow, on July 14.
To add a bit of suspense, we arrived in Leipzig with a still unfinished poster. A tiny little night shift at Café Telegraph settled things and on Wednesday, the very day of the poster presentations, we printed the actual poster on glossy paper in A0 format at the local print shop sedruck, their store at Beethovenstraße 23. The result was amazing, one of the best A0 printing experiences we had so far.
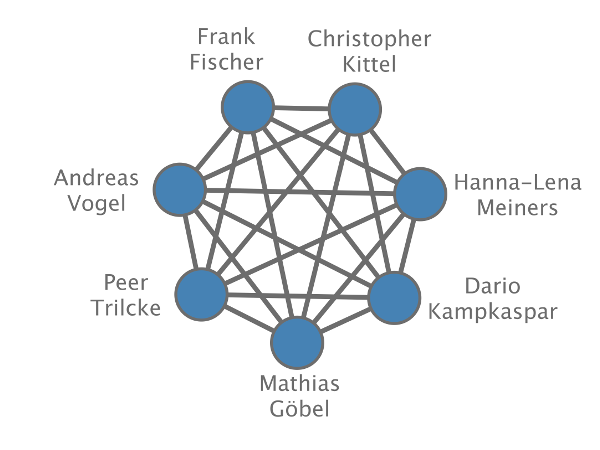
Credits
Creating this poster was a team effort:
Some Criticism
It was keynote speaker Daniel Keim himself who uttered some criticism when discussing the poster with us later that evening, broaching the problems of spring-embedder algorithms. And we couldn’t agree more: Spring embedders have “an undeniable aesthetic appeal, […] yet a random layout is nearly always the default” (source). One side effect of this is that graphs always look a tad different when generating them anew. Thus, similar graphs don’t always look similar. This is a mere graph-visualisation problem and not too relevant for the actual research we’re conducting with the network measures we calculate with our dramavis tool. But feel free to give us a hint on how to normalise graphs generated with spring-embedding algorithms.
Closing Words
Albeit the usual time pressure, it was great fun to plan, design and discuss our poster and to face some real competition. A big shout-out to our fellow winners who ranked 2nd (“Digitales Publizieren. Bedingungen – Optionen – Empfehlungen”) and 3rd (“Das Tool LAKomp und seine Anwendung auf Texte nichtstandardisierter Sprachstufen”). Right after the ceremony, we enjoyed a nice little dinner with the runners-up and some other friends at the dimly lit restaurant located in the Alte Nikolaischule building of which there is a twitpic here.
See y’all next year at the DHd2017 conference in Berne, CH.
